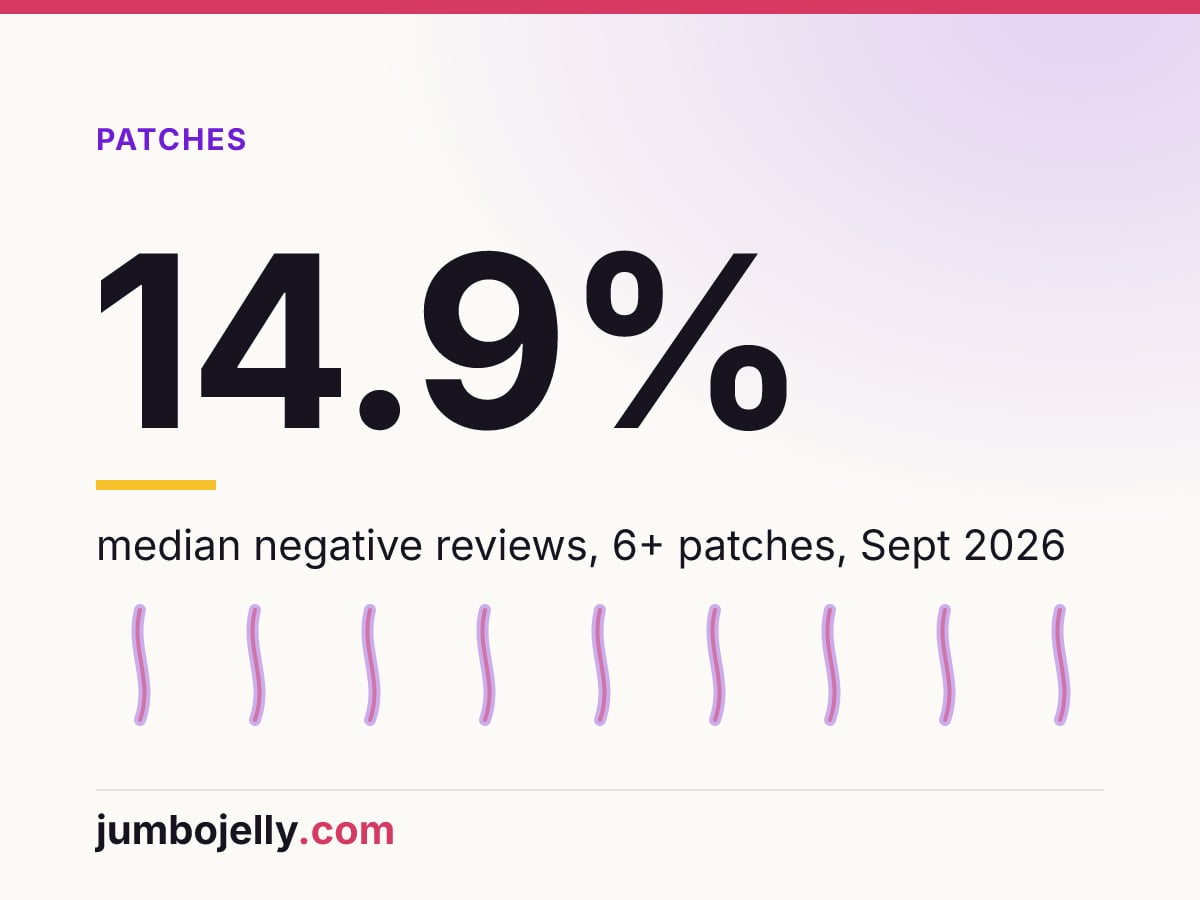
Steam games that patch more in their first month have worse early reviews: a median 14.9% negative for games with 6+ patch announcements in 30 days, against 8.3% for games with none, across 592 September 2026 launches. The patches are not the cause. Split by bug rate, the gap almost disappears, because buggy launches both patch more and collect more negative reviews.
Do games that patch more get worse Steam reviews?
On the raw numbers, yes, and in a straight line. We grouped the 592 September 2026 launches with at least 10 English reviews in their first 14 days by how many patch announcements they posted in their first 30 days. Each step up in patch count comes with more negative reviews and more reviews that mention bugs.
| Patch announcements in 30 days | Games | Median negative reviews | Median bug mentions | Share with 30%+ negative | Patched within 24 h |
|---|---|---|---|---|---|
| 0 | 95 | 8.3% | 2.1% | 14.7% | 0% |
| 1 to 2 | 156 | 10.0% | 5.0% | 15.4% | 11.5% |
| 3 to 5 | 163 | 12.1% | 6.9% | 16.0% | 22.7% |
| 6 or more | 178 | 14.9% | 9.4% | 19.7% | 42.7% |
Source: Steam Launch Bug Index, edition October 2026, computed 27 October 2026 (Steam launches in numbers). Negative and bug rates are from English reviews written in the first 14 days after release.
The bug column moves faster than the negative column. From zero patches to six or more, the median bug-mention rate rises 4.5 times (2.1% to 9.4%), the negative rate 1.8 times (8.3% to 14.9%). That already hints at what drives the pattern. If a fix is going out this week, run it through the patch day QA checklist first: it covers the beta branch, the rollback build and save compatibility, so the patch does not add bug reviews of its own.
The flip side of the table is the build that ships with fewer bugs. Games with zero patches had a median of 2.1% bug mentions, and the cheapest point to get there is before launch day. A one-day Smoke Test puts one outside tester on your release candidate for 8 hours, with a prioritized report in 2 business days.
Does the gap survive once you account for bugs?
Mostly not. We split the same 592 games at the median bug-mention rate of 6.5% and looked at patch count again inside each half. In the buggier half, the negative rate is flat at about 18% whatever the patch count. In the cleaner half it creeps up by 2.4 points.
| Patch announcements in 30 days | Bug mentions below 6.5%: games | Median negative | Bug mentions 6.5% or more: games | Median negative |
|---|---|---|---|---|
| 0 | 65 | 5.9% | 30 | 18.0% |
| 1 to 2 | 92 | 6.2% | 64 | 18.3% |
| 3 to 5 | 80 | 7.7% | 83 | 18.2% |
| 6 or more | 57 | 8.3% | 121 | 17.9% |
Two things stand out. The difference between the halves (about 12 points) is five times larger than any difference inside a half. And the buggy half is where the heavy patchers live: 40.6% of the buggier games posted 6+ patch announcements, against 19.4% of the cleaner ones.
A simple linear model says the same thing. On its own, each extra patch announcement goes with 0.2 more points of negative reviews. With the bug-mention rate in the model, the patch effect drops to roughly zero, while each point of bug mentions goes with about 0.6 points of negative reviews. This is a rough check on one month of data, not a causal estimate.
The small rise in the cleaner half has a plausible reading. Patch announcements also cover balance changes, content and performance, and players who dislike those leave negative reviews without using a bug word. We cannot separate that from noise with 57 to 92 games per cell.
Is the pattern the same for small, mid and large launches?
Roughly, with one sharp edge at the top. Size here is total reviews at the time of the index: small 10 to 99, mid 100 to 999, large 1,000 and more.
| Size | 0 patches | 1 to 2 | 3 to 5 | 6 or more |
|---|---|---|---|---|
| Small (n=436) | 8.3% (88) | 11.1% (124) | 12.1% (112) | 13.3% (112) |
| Mid (n=127) | 9.9% (6) | 8.3% (26) | 12.9% (40) | 15.2% (55) |
| Large (n=29) | 5.7% (1) | 6.2% (6) | 10.3% (11) | 20.0% (11) |
Median negative early reviews, number of games in brackets. Cells under 10 games are shown for completeness and should not be read on their own.
Among large launches, the 11 games with 6+ patches had a median 20.0% negative and 11.3% bug mentions; the 18 with up to 5 patches sat at 8.2% and 3.7%. Four of those 11 (36.4%) crossed 30% negative in their first two weeks. At that size, a run of patches is usually a sign of a public firefight. Among the 95 games with 200 or more total reviews, the ones with 6+ patches had a median 19.9% negative, the ones with 0 to 2 patches 6.8%.
Patch count also tracks audience. The median game with no patches had 17 reviews in its first 14 days; the median game with 6+ had 54.5. More players means more hardware, more bug reports and more reasons to ship a fix.
Is Early Access different?
It is the one group where more patching lines up with better reviews, and the sample is small. Early Access launches with 3 or more patch announcements had a median 12.6% negative, against 18.5% for those with 0 to 2. Their bug-mention rates were similar (11.8% and 10.0%).
| Group | Patches in 30 days | Games | Median negative | Median bug mentions | 30%+ negative |
|---|---|---|---|---|---|
| Early Access | 0 to 2 | 19 | 18.5% | 10.0% | 31.6% |
| Early Access | 3 or more | 64 | 12.6% | 11.8% | 12.5% |
| Full release | 0 to 2 | 232 | 9.0% | 4.0% | 13.8% |
| Full release | 3 or more | 277 | 14.1% | 7.7% | 19.1% |
Early Access players buy into an unfinished game and expect visible updates. A quiet first month may read to them as an abandoned one, even when the bug rate is the same. With 19 games in the quiet group, treat this as a question for the next editions, not a finding. The timing side of Early Access patching is covered in day one patch data from 592 launches.
Why is this probably reverse causality?
Because the order of events runs the other way. A launch with crashes collects bug reviews in its first days, the team reads them and ships fixes, and the patch count climbs. The patches answer the reviews. Three details in the data point the same way.
- Patch count tracks bug mentions more than negativity. The rank correlation between patch count and bug-mention rate is 0.31; between patch count and negative rate it is 0.14.
- The windows do not line up. Reviews come from the first 14 days, patches from the first 30. A patch on day 25 cannot have caused a review on day 3.
- Fast patchers are the buggy ones. 42.7% of the 6+ group patched within 24 hours, against 11.5% of the 1 to 2 group. A day one patch follows a loud first evening.
What the data cannot answer is whether a given game would have done better or worse with fewer patches. That needs a before-and-after comparison per patch, which the next edition of the index can add for games with 200+ reviews.
For the AI disclosure split that runs through the index, the numbers are close. Games with an AI Generated Content Disclosure posted a median of 4 patch announcements in 30 days, games without one a median of 3. We report the difference and do not read anything into it.
What does this mean for a studio planning its first month?
Patch cadence mostly reflects how the launch went. Steam itself says review score does not affect algorithmic visibility while a game stays at Mixed (40% positive) or above, so most launches in this sample were not losing visibility to their score. What they were losing was the first impression in reviews that stay on the page.
- Measure your bug rate at launch. Count how many of your first 50 reviews mention a crash, freeze or broken save. That number predicts your negative rate far better than your patch plan.
- Patch as often as the bugs require. The data gives no reason to hold back fixes to keep the count down.
- Test every patch build on a beta branch first. A fix that breaks saves turns one bad review into two. A regression pass on changed areas and saves is the minimum.
- Spend the effort before release. The cleaner half of the sample stayed under 9% negative at any patch count. Whatever lowers the bug rate before launch moves the number that matters.
The full September picture, including genre medians and the AI disclosure split, is in the Steam Launch Bug Index for October 2026.
How was this measured, and what are the limits?
The data is the public Steam Launch Bug Index, edition October 2026, built on 27 October 2026 from Steam’s public endpoints. It covers games with a September 2026 release date and at least 10 English reviews in their first 14 days (592 games). The CSV and method are on the Steam launches in numbers page.
- Announcements are counted, builds are missed. We count posts in the game’s Steam community announcements whose title or first 400 characters mention patch, hotfix, fix, bugfix or update. Silent depot updates are missed; roadmap posts that mention an update are counted.
- Bug mentions use a word list. A review saying “no bugs at all” counts as a bug mention, which inflates every group by a similar amount.
- Up to 300 reviews per game. Large launches are sampled from their most recent reviews inside the 14-day window.
- Some 30-day windows were not complete. 51 games released on 28 to 30 September had fewer than 30 days of announcements when the index ran. Without them (541 games) the medians barely move: 9.0%, 10.0%, 12.1% and 15.1% negative for 0, 1 to 2, 3 to 5 and 6+ patches.
- Small cells. Any cell under about 20 games can swing by several points between editions. We do not name games under 200 reviews.
We will rerun the same split on October 2026 launches in early November. If the buggier half stays flat at about 18% negative across patch counts, the reading above gets stronger; if it tilts, we will publish that too.